Analyzing Gender Gap in Chess
August 12, 2023 · 13 mins · 2363 words
Imagine a race in which 10,000 men and women participate. Before starting the race a random color is assigned to each participant regardless of shape, gender, race, or whatever. There are 9,000 red runners and 1,000 blue runners. If you had to bet, you would probably bet on a red runner, not because you know they are better runners, but because you know they are more likely to win. A similar situation occurs with the gender gap in chess. In this post, I will show that the domination of men in chess can be largely explained by a matter of participation.
While other factors like cultural and societal biases may be at play, the numbers don’t lie. I hope that by shedding light and data on this issue, we can start a conversation about how to promote greater gender diversity and inclusivity in the world of chess.
tl;dr
Using data from FIDE and using the methods defined in this paper I:
- extend the analysis of the paper to all the available countries. You can find all the code and results here.
- show that the gender gap in chess can be largely explained as a statistical artifact due to participation differences. In more than $90\%$ of the countries, the difference between the top male and the top female players can be explained by the difference in participation.
- explain that even if participation imbalances can explain some of the Elo rate differences it’s not enough to explain all of the differences. This indicates that we still have a lot of work to do to reduce these differences and give equal opportunities to everyone.
- show that in the paper some math approximations can be improved. I suggest using another approach that gives more accurate results.
- show that making normal approximations when you want to compare extreme events is not a good idea. A lot of things are normal around the middle, but not in the tails.
Introduction
The usual readers of the blog know that I love analyzing games from a statistical/math point of view (this and this). I like also playing chess (this and this), so today’s post is going to be focused on analyzing some chess data.
The other day -a few months ago- I was watching the World Chess Cup (WCC) and I started wondering why no woman has ever played in a WCC. The highest rating ever achieved by a woman is 2735 by Judit Polgár. Achieving such an Elo is at the hand of very few, however, the highest Elo ever achieved by a man is 2853, around 100 points more, and this difference is not negligible. In other words, Judit Polgár at her peak would be ranked 17th in today’s global ranking. And currently, the highest-rated woman, Hou Yifan, is ranked 55th.
All of this made me start thinking about these differences, and how can they be explained. I’m not a big fan of theories that rely on “intrinsic” differences between men and women to explain this kind of situation. I believe that these differences usually have their roots in sociology and not in biology.
After some googling, I found a lot of explanations about this gap (sociological, biological, theological, etc.), but one of them seemed really interesting. It basically said that there’s no real gap between genders in chess, it’s just a statistical artifact. The idea is that the gap between top players can be completely explained just by the imbalance between women and men playing chess. Two sources are supporting this theory (Bilalic et al. and Chessbase), but both of them only study data of one country (Germany and India respectively), so I wondered if their findings apply to other countries or if it was just an isolated case. The Chessbase post follows the same ideas as in the paper by Bilalic et al.
In this blog post, I’ll review the paper by Bilalic et al. and apply their methods to more countries. I’ll also propose other approaches that I believe are better suited for this kind of data. All the code and results can be reproduced using this notebook.
Methods
Data
Data was downloaded from FIDE website. I removed underage players (born after 2005) and inactive players. After cleaning the data I ended up with $114580$ players ($94\%$ male and $6\%$ female), with an average Elo=$1712 \pm 321$.
Maths
In this section, we will dive into the mathematical approach Bilalic et al used to analyze the gender gap in chess. The methodology is based on the idea that the more players in a group, the higher the chance of having a top-performing player. By comparing the expected and actual differences between the top male and female players, the analysis can determine if the gender gap is due to participation imbalance or other factors. The expected ranking is computed using a formula that takes into account the number of players and the distribution of their ratings. This methodology is grounded in statistical theory and provides a rigorous way to analyze the gender gap in chess.
Concretely, the implementation goes as this
- Compute the total number of male and female players, $n_{m}$ and $n_{f}$.
- Fit the global rating distribution to a normal distribution and obtain $\mu$ and $\sigma$.
- Compute the expected $k$ highest value after extracting $n_{m}$ and $n_{f}$ samples from $\mathcal{N}(\mu, \sigma)$, this is $\hat{E}(k, n_{m})$ and $\hat{E}(k, n_{f})$ respectively. Define $\Delta \hat{E}(k) = \hat{E}(k, n_{m}) - \hat{E}(k, n_{f})$ as the expected difference between the $k$-th male and female top players
- Compute the actual difference between the $k$-th male and female players $\Delta E(k)$.
- Compare $\Delta E(k)$ and $\Delta \hat{E}(k)$. If the difference between ratings is caused by the participation imbalance one would expect these values to be similar.
To compute the expected ranking they use the following formula
\[E_{\text{Bilalic}}(k, n) \approx (\mu + c_1 \sigma) + c_2 \sigma \frac{n!}{(n-k)!n^k} (\log n - H(k-1))\]where $c_1 = 1.25$, $c_2 = 0.287$, and $H(k)$ is the $k$-th harmonic number. The formula relies on some assumptions such as normality and big numbers, and its derivation can be found in the original paper.
Criticism
I have some criticism against the methodology explained in the last section, and it’s based on (1) the formula for $E(k, n)$ doesn’t give good results and (2) the normal approximation is not a good model.
I explained the first point in this post. Since this criticism doesn’t apply directly to this post I won’t talk more about it.
On the other hand, we have the assumption of normality. In the original paper, it doesn’t seem like a bad decision. In the figure below we see the ELO distribution for German players, and it seems that the normal fit is good enough.
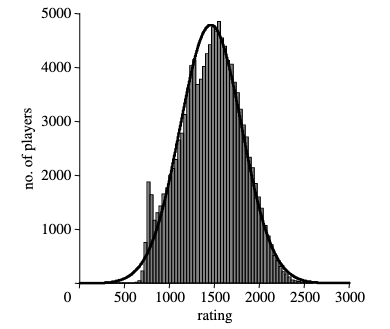
However, for our use case is not a good idea to use a normal distribution. There’s a saying that states many things are normal around the middle but not in the tails, and in our use case we’re particularly interested in what happens in the tails because we want to compare the ratings of the best male and female players. Therefore, assuming that the data is normally distributed is not a good idea.
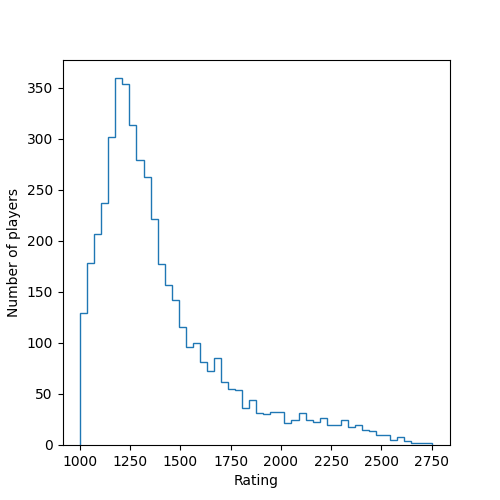
On the other hand, if we look at the rating distribution of other countries it’s obvious that it doesn’t follow a Gaussian. Here we see the distribution for India
Following these two arguments, I’ve decided to drop the normal assumption. Instead, I’ll use bootstrapping when needed, ie: to compute the expected $k$ rating after drawing $n$ values I’ll draw $n$ values with repetition from the actual data and compute the average rating of the $k$ rating. This can be done with the following method
def expected_elo_bootstrapping(n: int,
                               k: int,
                               ratings: Sequence[float],
                               n_experiments: int = 100) -> Tuple[float, float]:
    sample = np.random.choice(ratings, size=(n_experiments, n))
    sorted_sample = np.sort(sample)
    k_mean = np.mean(x[:, -k])
    k_std = np.std(x[:, -k])
    return k_mean, k_std
Results
Difference between the best players
Now let’s study the difference between the best male and female players for each country. To do so I computed the actual difference between the best players of each country and the expected difference due to gender imbalance (using bootstrapping). Notice that the expected difference is computed without using the gender data, to compute it we only need to know how many players are in each group.
The results for each country are plotted below. The blue dot is the simulated difference between the top male and female (with an error bar of 2 standard deviations, ie 95%), and the black dot is the actual difference between the top players. If the actual difference is inside the error bar it means that there’s more than a $5\%$ probability that the difference can be explained by chance.
In around $92\%$ of the countries, the difference can be explained by participation rates, which means that the gap gender can be explained by chance. I find it interesting that even in Norway -the country of the current best chess player- the gender gap is explainable by participation imbalance.
However, it cannot be ignored that in most cases the observed difference is greater than the expected one. Imho this means that there’s still a lot of work to be done to reduce these differences and give equal opportunities to everyone.
Difference between all top players
In the last section, we compared the results of the top 1 players, but it can be generalized to the top $k$ players in each country.
In the following plots, I show the difference between the top-$k$ players in different countries.
The x-axis of the plots is the rank of the players, the white square is the difference between the players with that rank, and the black square is the expected difference computed via bootstrapping.
The case of India it’s particularly interesting since the expected difference is much higher than the actual difference, which means that Indian women are playing much better than expected, which I believe it’s completely amazing.
In the case of Israel, all the differences can be clearly explained just by population imbalance. This is the country where it’s more clear that the difference it’s just a fabrication.
Then we have cases like Spain, where the difference can’t be explained only by participation rates. In this kind of case, one would need to study with more depth the sociological situation of these countries to understand why women are not developing their chess skills as expected.
If you’re interested in other countries you can use the code here to generate the corresponding plots.
Conclusions
In conclusion, the gender gap in chess can be largely explained as a statistical artifact due to the difference in the number of players between genders. By analyzing the data from more than 100 countries, we found that in more than 90% of them, the difference between the top male and female players can be explained by chance. This is contrary to popular beliefs, which attribute the gap to intrinsic differences between men and women. Our analysis is based on a rigorous mathematical approach, which involves using bootstrapping for computing the expected highest ranking for male and female players. We also highlighted a few issues with previous studies that attempted to address this topic, and we proposed an alternative approach that provides more accurate results.
However, it’s also clear from the analysis that the participation imbalance can’t be held as the only responsible for the gender gap in chess. As in any other sociological situation, the root cause is usually complex, and it can’t be usually explained with only one reason. Imho it’s important to avoid reductionism when dealing with this kind. of problems, since the first step to achieving a good answer is to ask the correct question. In this case, the correct question is not “How do we make more women participate in chess?” as if solving this question would solve the gender gap in chess. There’s more to it than just the number of players. We need to look at many things to understand why there’s a difference. Things like how society thinks, how kids are introduced to chess when they’re young, and who they see as examples. People often think chess is mostly for guys, and that affects things too. It’s important to realize that all these factors mix together and are necessary for making chess open to everyone. If we change how people think and make sure everyone feels welcome, we can start to fix the difference between men and women in chess. As we’ve seen there are some countries where the gender gap can be explained only by participation imbalance, which means that the other problems can be solved if tackled properly. In the end, it’s about talent, not just being a guy or a girl.